DeepInfer is the inference engine DeepSeek uses to serve DeepSeek-V4.1-Flash in production. DeepSeek (the deepseek-ai GitHub org) open-sourced it on October 20, 2026 under Apache-2.0, originally built primarily on vLLM, with about 46,000 lines of Python plus a C++ scheduler. It serves one model (a 552B-parameter MoE with 384 routed experts, 6 active per token) on NVIDIA SM100 and Huawei Ascend 950. I forked it on release day and have been reading it since. This post explains each feature from the ground up and points at the exact files: the request lifecycle, the kernels (FlashMLA, DeepGEMM, DeepEP, TileLang), attention data parallelism and expert parallelism with EPLB, DSpark drafting with confidence-scheduled verification, SWA bounded replay, zero-overhead asynchronous scheduling, batch-invariant inference, deterministic sampling and structured outputs. It is an offline-inference release, not a full serving stack: the KV cache store, prefill/decode disaggregation and load balancers are not included.
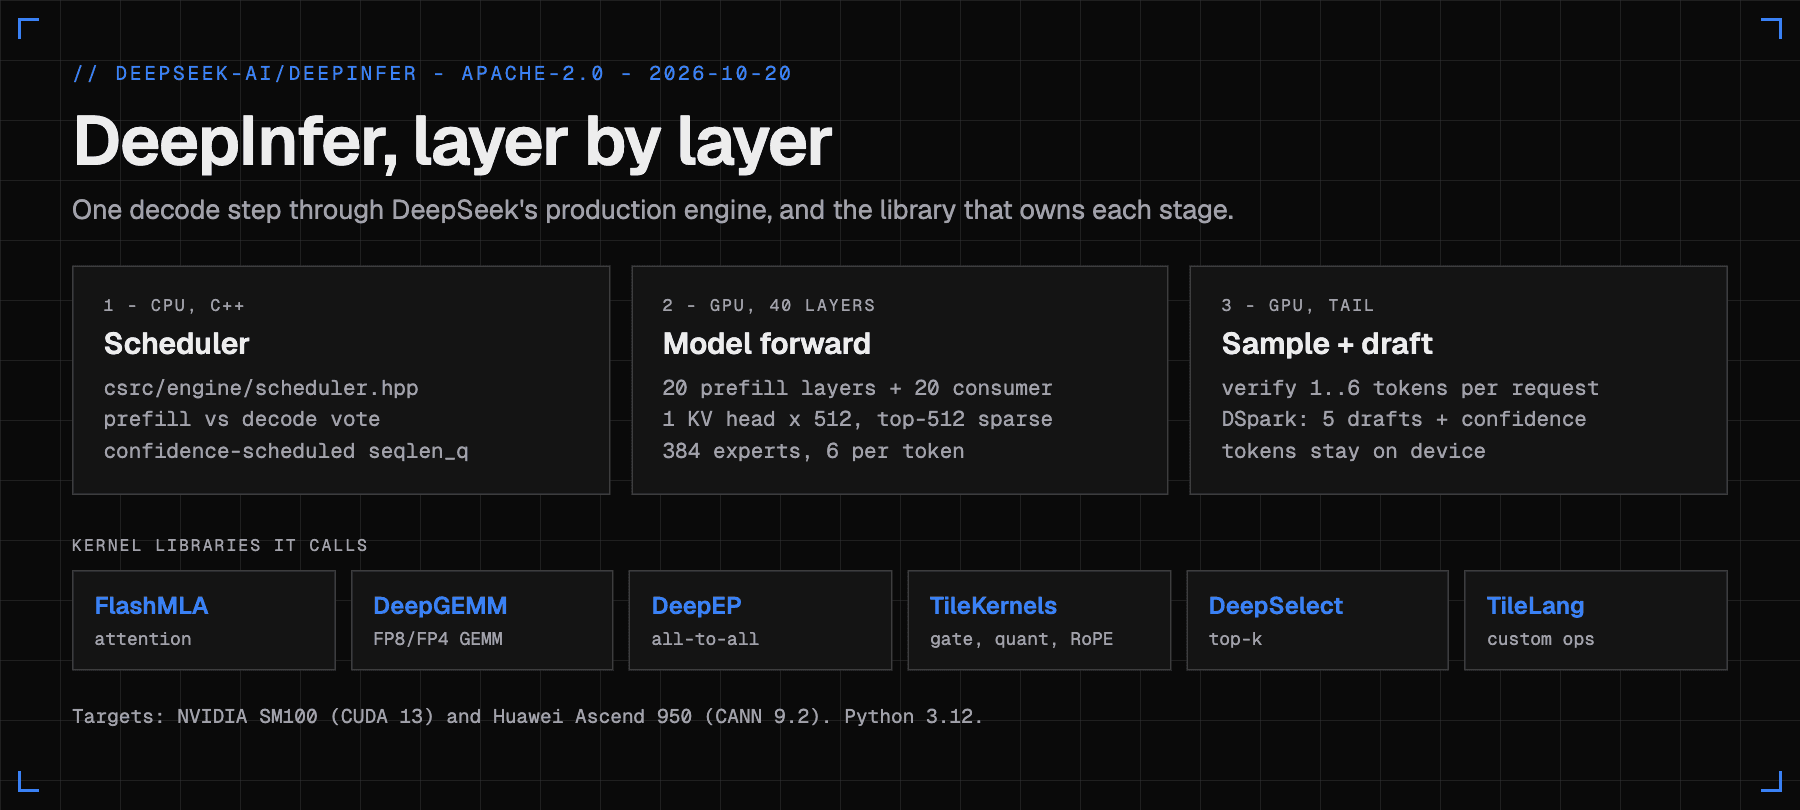
What is DeepInfer, and who actually made it?
DeepInfer is DeepSeek's engine. The README opens with "DeepInfer is the high-performance inference framework that powers DeepSeek's large-scale production services", the repo lives at github.com/deepseek-ai/DeepInfer, the citation block credits "DeepSeek-AI", and the first commit in the git history (d585e65, dated 2026-10-20) is by Jiashi Li, a DeepSeek-AI author on the DSpark paper.
Here are the verified facts:
| Fact | Value | Source |
|---|---|---|
| Org / repo | deepseek-ai/DeepInfer (my fork: vakharwalad23/DeepInfer) | GitHub, git remote -v |
| Released | October 20, 2026, announced on X the same day | DeepSeek post, press coverage |
| Engine license | Apache-2.0 | LICENSE, README |
| Kernel libraries it bundles | MIT (FlashMLA, DeepGEMM, DeepEP, TileKernels, DeepSelect) | each repo |
| Model weights license | MIT (DeepSeek-V4.1-Flash-1017) | Hugging Face model card |
| Lineage | "originally built primarily on vLLM", ideas from SGLang and TensorRT-LLM | README acknowledgments |
| Supported model | DeepSeek-V4.1-Flash, nothing else | README |
| Hardware | NVIDIA SM100, Huawei Ascend 950 | README |
| Companion release | deepseek-recipe (request encoding, output parsing) | repo Q&A, TechNode |
DeepSeek announced it with a short thread:

The release is deliberately partial. The README lists what a complete service still needs and does not ship: a KV cache system, vision-encoder/prefill/decode disaggregation (most of the engine-side code for it is present), and load balancing across data-parallel replicas. The Q&A document in doc/inference_deployment_qa.md says one production cluster serves 155 trillion tokens per day at US$38 of revenue per GPU-hour (valley pricing). Those are DeepSeek's own figures from that document. I could not find an independent rerun of them (vLLM's comparison, covered below, reads DeepSeek's charts rather than rerunning DeepInfer), and I did not run anything myself: DeepInfer needs CUDA 13 and SM100 GPUs, and I work on a Mac.
The kernel libraries did not appear all at once. DeepInfer is the point where they finally have a host program:
What model does DeepInfer serve?
Everything in the engine bends around one model, so you need its shape in your head. These numbers come from the model's config.json on Hugging Face, which DeepInfer parses in deepinfer/hugging_face/config.py.
| Setting | Value |
|---|---|
| Layers | 40 backbone layers, plus 3 draft layers (num_nextn_predict_layers) |
| Hidden size | 5120 |
| Attention | 64 query heads, 1 KV head, head dim 512, query rank 1280 |
| Window | sliding window 128 tokens |
| Sparse selection | indexer with 32 heads, index_topk = 512 |
| Routed experts | 384, 6 per token, plus 1 shared expert |
| Expert width | moe_intermediate_size = 2304 |
| Context | 1,048,576 positions (YaRN rope scaling) |
| Expert precision | FP4 (MXFP4, per-32 scales), activations FP8 |
DeepSeek's V4.1-Flash paper (arXiv 2609.19969) reports a 552B-parameter backbone with 16B active per token in decode and 8B in prefill, a million-token context, and a global KV cache of 890 bytes per token. The Hugging Face metadata counts about 763B stored parameters, which I assume includes the large n-gram embedding tables for the Engram layers (the config lists tables of about 384 million rows). That last part is my guess, not a stated fact.
You can sanity-check the 552B and 16B with arithmetic. One expert is a SwiGLU block with three matrices of 5120 by 2304:
params per expert      = 3 * 5120 * 2304            = 35.4 M
routed experts, 1 layer = 384 * 35.4 M              = 13.6 B
routed experts, 40 layers                           = 543.6 B   (close to the 552B backbone)
touched per token (6 routed + 1 shared) * 40 layers = 9.9 B     (16B active minus attention and the rest)
So almost all the weight sits in routed experts, and a token only touches about 2 percent of them. This is the entire reason for expert parallelism later. It is also why decode is memory-bound: you must stream weights through the GPU to produce one token, and every extra token in the batch makes that read cheaper per token.
Why this attention is cheap on memory
Classic multi-head attention caches K and V for every head. If this model did that, with 64 heads of width 512, the cache would cost:
64 heads * 512 dim * 2 (K and V) * 2 bytes (bf16) * 40 layers = 5,242,880 bytes = 5 MiB per token
That is a hypothetical, but it shows the scale: a million-token context would need about 5 TiB for one sequence. The real design is MLA-style: one shared KV head of width 512, KV stored in low precision (main KV in FP4 with per-16 scales and indexer keys in MXFP4, according to the Q&A), a 128-token sliding window for local detail, and a sparse top-512 selection by a "lightning indexer" for long range. The paper's headline is 890 bytes per token for the global cache, roughly a 6000x reduction against that naive number. The code for this lives in deepinfer/model_executor/models/v4_modules/ (attn.py, mla_attn.py, index_attn.py, compress.py).
Twenty layers prefill, twenty layers "consumer"
One more structural fact matters later. DeepInfer treats the model as a causal encoder-decoder (the Q&A calls it CED, and the code calls the second half "YOCO consumer" layers, after "You Only Cache Once"). This function in deepinfer/hugging_face/config.py finds the split:
def _n_prefill_layer(text: dict[str, Any]) -> int:
    """The first layer with ratio==1: it and everything before it form the prefill side, the layers after it are yoco consumer layers."""
    ratios = text["compress_ratios"]
    return next(i for i, ratio in enumerate(ratios) if ratio == 1)
In the config, compress_ratios is 0 for layers 0 and 1, 2 for layers 2 to 19, and 1 for layers 20 to 39. So n_prefill_layer is 20: the first 20 layers build the full KV cache, and the last 20 only produce their own sliding-window cache. That split is what makes "bounded replay" possible. I come back to it in the SWA section.
How does a request move through DeepInfer?
Start with the vocabulary. Prefill processes the whole prompt in one or a few big chunks. It is compute-bound: thousands of tokens per forward pass, matrices are large, GPUs run near peak FLOPs. Decode generates one token per request per step. It is memory-bound: a batch of a few thousand tokens at most, and each step must read all active weights and the KV cache. The two phases want different hardware settings, which is why DeepSeek's production deployment disaggregates them (EP2 to 8 for prefill, EP64 to 128 for decode, per the Q&A).
The offline engine in this repo still runs both phases in one process. Here is the path of one request:
The entry point is deepinfer/entrypoints/llm.py (LLM.generate, which calls _run_engine). Each iteration calls LLMEngine.step() in deepinfer/engine/llm_engine.py. That function does three things: ask the scheduler for work, run bookkeeping (state cloning for the KV store, multimodal fetch), and hand the batch to the workers through _run_workers("execute_model_step", ...).
The scheduler is C++, and it votes
Scheduling per step is pure CPU work, and Python was too slow for a loop that must finish in microseconds. csrc/engine/scheduler.hpp (1,329 lines) owns the waiting and running queues, the block manager and the speculative-decoding budget. A sequence's life is a small state machine (SequenceStatus in csrc/engine/sequence.hpp):
The interesting part is the step type. With attention data parallelism, every DP rank holds its own requests, but expert parallelism needs all ranks to run the same kind of step together, because the MoE all-to-all is a collective. A rank that decodes while its peers prefill would deadlock or waste time. So _schedule() for a NORMAL engine runs a vote:
bool is_any_point = (decode_step != 0) && (decode_step % prefill_any_attempt_interval == 0);
bool is_all_point = (decode_step % prefill_attempt_interval == 0);
if (!is_any_point && !is_all_point) {
    return _schedule_decode(acquire);
}
bool want = (get_gpu_cache_usage() <= GPU_CACHE_PREFILL_WATERMARK) && _has_prefill_waiting();
if (is_any_point) {
    do_prefill = (_dp_allreduce(want ? 0 : 1, c10d::ReduceOp::MIN) == 0); // any rank wants it
} else {
    do_prefill = (_dp_allreduce(want ? 1 : 0, c10d::ReduceOp::MIN) == 1); // every rank wants it
}
Every DEEPINFER_PREFILL_ATTEMPT_INTERVAL (default 70) decode steps, the group does a prefill only if all ranks have prompts waiting, so one busy rank does not drag idle peers through an empty prompt step. Every DEEPINFER_PREFILL_ANY_ATTEMPT_INTERVAL (default 100) steps, any rank with waiting work forces a prefill, so a lonely request waits at most 100 decode steps. The watermark GPU_CACHE_PREFILL_WATERMARK is 0.9: no new prompts when the KV cache is 90 percent full. That is a fairness-versus-efficiency knob in about ten lines.
KV cache: blocks plus a state slot
DeepInfer's cache is not one array. deepinfer/worker/cache_engine.py (978 lines) manages two things:
- Paged blocks for the compressed main KV and the indexer keys: a block is 128 tokens, and the compressed layers store
block_size // ratioentries per block. - State slots for everything with fixed size per sequence: the sliding-window ring buffer (
swa_block_size = window + max backtracking tokens) and compression boundary accumulators. One slot per sequence, sized at 1.2x the sequence count by default (DEEPINFER_NUM_STATE_SLOTS_RATIO).
The SWA entry is 528 bytes per token per layer (MXFP8). The Q&A gives the stored size per sequence: 20 layers times 134 tokens times 528 bytes is 1,415,040 bytes, about 1.35 MiB. A million-token conversation costs that much in SWA state, no matter how long it is.
CUDA graphs for decode
A decode step launches hundreds of small kernels. Launching them from Python one by one would cost more than running them. deepinfer/worker/cuda_graph_runner.py captures the whole forward pass as a CUDA graph for a set of batch sizes and replays it. The sizes come from this helper:
def build_graph_batch_sizes(max_size: int, interval: int) -> list[int]:
    interval = min(interval, max_size)
    batch_sizes: list[int] = []
    size = 1
    while size < interval:
        batch_sizes.append(size)
        size *= 2
    batch_sizes.extend(range(interval, max_size, interval))
    batch_sizes.append(max_size)
    return batch_sizes
With the default interval of 8 and a max of 64 you get 1, 2, 4, 8, 16, 24, and so on up to 64. A batch of 37 tokens runs the size-40 graph with padding. That padding is why the scheduler cares about graph sizes (see the DSpark section): verifying one more token is free if it fits in the same graph.
What do FlashMLA, DeepGEMM, DeepEP and TileLang each do?
DeepInfer itself is mostly orchestration. The heavy math happens in libraries released earlier (five of them DeepSeek's own), all MIT licensed. Each exists because a general-purpose library was too slow for one specific shape of work.
| Library | What it computes | Why it exists | Where DeepInfer calls it |
|---|---|---|---|
| FlashMLA | Sparse and dense attention for prefill and decode, FP8/FP4 KV | Generic attention kernels do not understand MLA's single wide KV head plus top-512 sparse indices | v4_modules/attn.py (decode_mla_mqa_sparse) |
| DeepGEMM | FP8/FP4/BF16 GEMMs, grouped MoE GEMMs, Mega MoE, indexer scoring | Expert matmuls have ragged row counts per expert; scale factors need packed UE8M0 layouts | v4_modules/mlp.py, runtime_config.py |
| DeepEP | MoE dispatch and combine all-to-all over NVLink and RDMA, plus bucket all-gather | NCCL all-to-all is not tuned for per-token expert routing with FP8 payloads | mlp.py, parallel_utils/cp.py |
| TileKernels | MoE top-k gate, FP8/FP4 casts, SwiGLU plus quantize, RoPE, hyper-connection ops | Small fused ops that PyTorch would run as many launches | mlp.py, v4_modules/hc.py |
| DeepSelect | Top-k selection (2 to 20x faster than torch.topk), used by the indexer and the sampler | Picking 512 of a very long score list, and picking tokens from a 129,280 vocabulary, are on the critical path every step | indexer and sampler |
| TileLang | A Python DSL for writing GPU/NPU kernels | One source for NVIDIA and Ascend: DeepInfer's own ops are written once | model_executor/layers/tilelang_ops/ (about 90 files, including CUDA and Ascend variants) |
Two details are worth seeing in code. First, the MoE layer uses the cheapest path available. In mlp.py the choice looks like this:
self.use_mega_moe = (
    (PLATFORM.is_gpu or self.mma_type == "fp8xfp4")
    and self.mma_type in ("fp8xfp4", "fp8xfp8", "bf16xbf16")
    and PG.is_within_nvl_domain(PG.expert_parallel_group())
)
Mega MoE (a DeepGEMM kernel) fuses EP dispatch, both expert linear layers, SwiGLU and EP combine into one kernel, overlapping NVLink traffic with tensor-core compute. It needs all expert-parallel ranks inside one NVLink domain. The Q&A says it is the general solution inside a scale-up domain: faster than unfused MoE regardless of EP size or batch size. When it is off (say, across nodes), the layer falls back to the explicit path: DeepEP dispatch, deep_gemm.m_grouped_fp8_fp4_gemm_nt_contiguous, then combine.
Second, the dispatch call shows how much the communication is tuned. This is the real call, lightly trimmed:
event_overlap = self.ep_buffer.dispatch(
    x=hidden_states,
    num_sms=envs.DEEPINFER_USERBUFFER_COMM_SMS,
    topk_idx=topk_idx,
    topk_weights=topk_weights,
    cumulative_local_expert_recv_stats=self._eplb_layer().expert_count,
    num_experts=self.num_physical_experts,
    expert_alignment=deep_gemm.get_mk_alignment_for_contiguous_layout(),
    async_with_compute_stream=True,
    do_expand=True,
    use_tma_aligned_col_major_sf=True,
    defer_epilogue=True,
)
Notice cumulative_local_expert_recv_stats: the dispatch kernel itself counts how many tokens each expert received. That counter feeds EPLB for free. And expert_alignment pads each expert's rows to the GEMM tile size, so the grouped GEMM never sees a ragged tile.
The Q&A also admits the open-source kernel libraries are not identical to the internal ones: FlashMLA lacks one hand-tuned SASS optimization, making the decode kernel 5 to 10 percent slower, and end-to-end the gap is at most 5 percent.
How does DeepInfer split work across GPUs: attention DP, balanced CP, MoE EP?
Parallelism is where the 384 experts and the million-token context meet real hardware. DeepInfer uses three axes, plus a data-parallel layout for attention:
Attention data parallel (DP). Attention cost depends on each request's own KV cache, and with one KV head the cache is small, so there is no reason to split a single sequence across GPUs. Each DP rank runs a disjoint set of requests, fully independently, with no all-reduce inside attention. The Q&A states the rule #DP = #EP: every rank is both a DP rank for attention and an EP rank for experts. It also says TP and CP are not used in production for now (the repo still ships CP, below). You launch it like this (from examples/README.md):
python examples/offline_inference.py --ep 8
python examples/offline_inference.py --ep 2 --dp 8
python examples/offline_inference.py --ep 2 --cp 8
Balanced context parallel (CP). For a very long prompt, one rank's prefill would take too long, so CP splits one prompt across cp ranks. The catch is causality: the tail of a prompt attends to everything before it, so the tail costs far more than the head. Splitting the prompt into equal contiguous pieces would leave the last rank with most of the work. DeepInfer uses a "mirror" split: the scheduler aligns each sequence to cp_size * 2 (cp_align in scheduler.hpp), cuts it into 2 * cp chunks, and (the standard trick) pairs a cheap head chunk with an expensive tail chunk on each rank, such as chunk r with chunk 2*cp - 1 - r. That is the standard zigzag pairing, and the reference version of the mirror index builder in tilelang_ops/prepare_cp_mirror.py confirms it (each rank takes blocks rank and 2 * cp_size - 1 - rank). The all-gather runs through DeepEP's BucketBuffer (parallel_utils/cp.py).
Expert parallel (EP). With 384 experts, EP64 gives each GPU 6 experts (7 after redundancy, below). Why go wide? Count the weight bytes each GPU must read per decode step. One expert at FP4 is about 17.7 MB (35.4 M params at half a byte, ignoring scales). Per GPU, over 40 layers:
EP8 : 48 experts/GPU * 17.7 MB * 40 layers = ~34 GB read per step
EP64:  6 experts/GPU * 17.7 MB * 40 layers = ~4.2 GB read per step
That is 8x less weight traffic per step, and each expert now serves tokens gathered from 64 ranks, so each weight read is shared by far more tokens. The Q&A's "Wide-EP" chart makes the same point with measured EP8 vs EP64 curves. The cost is the all-to-all and, crucially, load imbalance.
Why do experts get unbalanced, and what is EPLB?
The router picks 6 experts per token from a learned score. Training encourages spread, but real traffic is lumpy: a batch of code questions favors some experts, a batch in another language favors others. In an EP layer, a step is only as fast as the slowest rank, because everybody waits at the combine. DeepInfer logs this as moe_lb: slowest rank load divided by mean rank load.
Here is a toy example with 8 experts, 4 GPUs (2 each), and 1,000 tokens choosing 2 experts each, so 2,000 assignments. Say the router sends 600, 400, 300, 200, 150, 150, 100 and 100 assignments to experts 0 to 7. Plain placement puts experts 0 and 1 together on GPU 0:
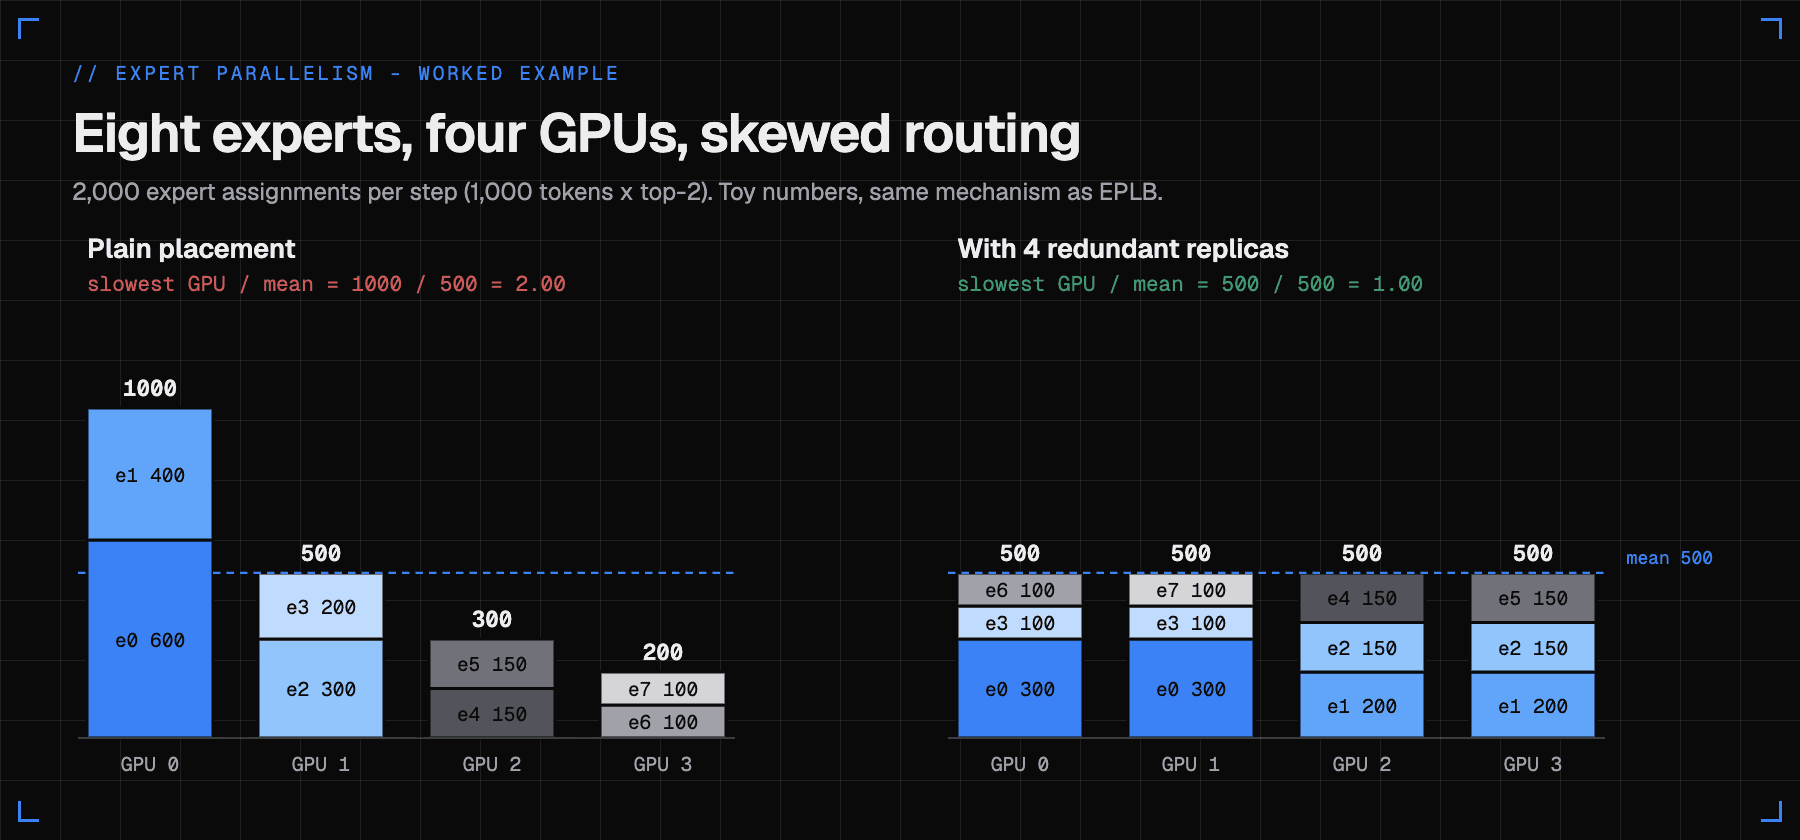
GPU 0 gets 1,000, the mean is 500, so moe_lb is 2.00: the whole layer runs at half speed. EPLB (expert-parallel load balancer) fixes this by adding redundant replicas of hot experts and re-placing everything. With 4 spare slots, replicate experts 0 to 3 (their load splits in half across copies), then pack: GPU 0 gets e0a(300) + e3a(100) + e6(100), and so on. Every GPU lands at exactly 500. In production the result is not perfect but close: DeepSeek's Q&A reports measured moe_lb of 1.074 (EP4DP4) and 1.045 (EP2DP2) for prefill, and 1.090 for decode.
The mechanism, from the Q&A and deepinfer/model_executor/eplb/:
- Count. The DeepEP dispatch records tokens per expert, per layer, every step.
- Window. Keep the last N steps (
DEEPINFER_EXPERT_COUNT_WINDOW_SIZE, default 100; production decode uses 1,000). - Replicate. A greedy loop in
policy.py(rebalance_experts_global) adds a replica to whichever expert minimizes the sum, over the history steps, of the peak per-copy load. - Pack.
_batch_greedy_indicesplaces copies onto ranks. The objective it minimizes, per layer, is the sum over history steps of the maximum per-rank load, so it balances over many steps rather than the last one. - Shuffle. Expert weights move between GPUs (
shuffle.py: NCCL batched point-to-point in general, NVLink symmetric memory within one node), every 1,000 steps for prefill and 10,000 for decode in production.
Here is the core of the packing step, which scores each candidate rank by the peak it would create:
torch.add(loads, vector.unsqueeze(1), out=candidates)
torch.maximum(candidates, peaks.unsqueeze(1), out=candidates)
torch.sum(candidates, dim=-1, out=scores)
scores.masked_fill_(occupancy == capacity, float("inf"))
rank = scores.argmin(dim=-1)
The redundant-expert counts are knobs. Prefill starts at 4 redundant experts per GPU, decode at 1 (rounded up so total experts divide evenly: at EP64 that makes 7 experts per GPU, 448 physical slots for 384 logical experts).
How much of the imbalance is just noise? Take a decode step at the production operating point: about 60 sequences per rank, 64 ranks, roughly 3.6 verified tokens each, so about 13,700 tokens, or 82,500 expert assignments over 384 experts. Even with a perfectly uniform router, each GPU hosting 6 experts expects about 1,289 assignments with a standard deviation near 36 (Poisson noise, 2.8 percent). The expected maximum of 64 such GPUs sits about 2.4 standard deviations above the mean: moe_lb of roughly 1.07 from noise alone. That is my back-of-envelope, but it shows the measured 1.090 is not far from a floor that no placement can beat.
How does DSpark speed up decoding with confidence-scheduled verification?
Speculative decoding from the ground up
An LLM generates one token per forward pass, and each pass reads all active weights. Speculative decoding breaks that: a cheap drafter guesses the next several tokens, then the big model verifies all guesses in a single pass, because a forward pass over 6 tokens costs barely more than over 1 (the weights are read once either way). Tokens that match what the big model would have produced are kept, the first mismatch is replaced by the big model's own token, and everything after it is thrown away. If you have read my Bear the Tokens post, that is the same idea with a model-free suffix drafter. DSpark uses a trained drafter.
The math is short. Let p_i be the chance that draft token i is accepted given the earlier drafts were. The chance that the first k all survive is the running product. Expected tokens per step is one guaranteed token plus the sum of those products. Example with five drafts:
| Position | p_i | Prefix survives |
|---|---|---|
| 1 | 0.90 | 0.9000 |
| 2 | 0.80 | 0.7200 |
| 3 | 0.70 | 0.5040 |
| 4 | 0.50 | 0.2520 |
| 5 | 0.30 | 0.0756 |
Sum of the right column: 2.4516. Add the guaranteed token: 3.45 tokens per step instead of 1. But look at position 5: it adds only 0.076 expected tokens and still costs a full slot in the verification batch.
The drafter
DSpark (arXiv 2607.05147, DeepSeek-AI with Peking University, July 6, 2026) is a drafter that emits a block of tokens in one parallel pass, then repairs the weakness of parallel drafting (tokens do not see each other) with a light sequential module. In V4.1-Flash the drafter is part of the checkpoint. These fields in config.json define it:
"num_nextn_predict_layers": 3,
"dspark_block_size": 5,
"dspark_target_layer_ids": [37, 38, 39],
"dspark_markov_rank": 256,
"dspark_n_routed_experts": 128,
"dspark_num_experts_per_tok": 3
It reads hidden states from the last three target layers, drafts a block of 5, and has its own small MoE (128 experts, 3 active). The paper reports 60 to 85 percent faster per-user generation at matched throughput against the production MTP-1 baseline, on live DeepSeek-V4 traffic. The code is deepinfer/model_executor/models/mtp/dflash.py (the file name is DFlash, the model name is DSpark). Besides drafts, it has a confidence head: a one-output linear layer over the hidden state and the Markov embedding, with a per-position temperature:
self.proj = ReplicatedLinear(
    input_size=n_embed + markov_rank,
    output_size=1,
    weight=weight,
)
Its output is the estimated chance that each draft survives. That number is p_i from the table above, produced per token, per request, per step.
Why fixed-length verification wastes compute
Without confidence, you verify all 5 drafts for every request. But requests differ: a boilerplate JSON closing brace is nearly certain, a creative sentence is not. Low-confidence suffix tokens occupy batch slots and are mostly rejected. DSpark's answer, described in the Q&A, is to treat verification slots as a budget and spend them where the marginal return is highest.
How the scheduler picks the budget
Env var DEEPINFER_ENABLE_MTP_VARLEN=1 turns this on. DEEPINFER_USE_NEXTN_DECODE (default 5) caps the draft length. The algorithm in csrc/engine/mtp_varlen.hpp (MTPVarlen::schedule) is a sort plus a sweep:
- Take every draft token of every request with its survival estimate.
- Sort all of them by estimate, highest first, across the whole batch.
- Start with the guaranteed one token per request. Walk down the sorted list, adding one token at a time. After each, compute expected tokens divided by predicted step time, where step time comes from a profiled decode performance curve of (graph size, milliseconds).
- Keep the batch size with the best throughput. The top of the list up to that point is verified, the rest is dropped.
Here is the sweep, trimmed from the source:
double best_throughput = 0.0;
int best_bsz = 0;
float cur_expected = static_cast<float>(num_seqs);
int cur_bsz = num_seqs;
update_best();                       // only the golden tokens
for (auto &acc : acc_queue_for_bsz) {
    cur_expected += acc.first;       // one more draft token, worth acc.first expected tokens
    cur_bsz += 1;
    update_best();                   // throughput = cur_expected / time_ms(graph_size(cur_bsz))
}
The step time is not linear because the graph sizes are discrete (the code also adds a sampler-time estimate and a fitted slope on top of the profiled curve). Here is a toy example (the curve is invented, the logic is the code's). Two requests, A with survival [0.95, 0.85, 0.60, 0.30, 0.10] and B with [0.70, 0.40, 0.20, 0.10, 0.05]. Assume step time 18 ms up to batch 4, 19 ms up to 6, 21 ms up to 8, 25 ms beyond:
| Batch size | Added token (survival) | Expected tokens | Step ms | Tokens per ms |
|---|---|---|---|---|
| 2 | none | 2.00 | 18 | 0.111 |
| 4 | A 0.95, A 0.85 | 3.80 | 18 | 0.211 |
| 6 | B 0.70, A 0.60 | 5.10 | 19 | 0.268 |
| 8 | B 0.40, A 0.30 | 5.80 | 21 | 0.276 |
| 12 | all remaining | 6.25 | 25 | 0.250 |
The best is batch size 8: A verifies 4 extra tokens (query length 5), B verifies 2 (query length 3), and the four least likely drafts are never verified. Verifying all of them would be 10 percent slower in this toy. That uneven per-request query length is what "varlen" means: the verify pass is a variable-length batch (seqlens_q differs per request) instead of a fixed 1 + 5 per request. It is why FlashMLA's varlen interface matters here.
DeepSeek's own numbers from the Q&A (computed from EP64/DP64 benchmark data):
| Concurrency (seqs per rank) | Fixed-5 tok/s/rank | Dynamic tok/s/rank | Gain |
|---|---|---|---|
| 16 | 4,891 | 4,816 | -1.5% |
| 32 | 8,964 | 9,111 | +1.6% |
| 60 | 13,730 | 14,466 | +5.4% |
| 96 | 16,817 | 18,660 | +11.0% |
The first bar series is fixed-5, the second is dynamic length. The pattern makes sense: when the batch is small, GPU time is cheap, so verifying everything is fine and the sort does nothing (slightly negative at 16). As concurrency rises, every verified token competes with other requests, and pruning pays. At the production operating point of about 60 sequences per rank, dynamic verification cuts verified tokens per step from 5.00 to about 3.58 while the accepted length barely moves (3.30 to 3.21), for +5.4 percent. The Q&A summarizes the range as +4 to 7 percent. Take these as DeepSeek's estimates, not independent measurements.
vLLM announced its own DSpark support with adaptive verification on September 10, about six weeks before DeepInfer landed:

There is a subtle problem inside the scheduler: with asynchronous scheduling (next section), when the CPU schedules step N+1, step N has not finished, so its confidence has not arrived. The code comment explains the rule: use the accept rates from round N-2 to size the total budget, and round N-1 to split it per request. When the previous round's numbers are not yet on the host, the per-request lengths are recomputed on the GPU. That kernel is in tilelang_ops/schedule_mtp_varlen.py:
cum_rates = torch.cumprod(gathered_rates, dim=1)      # prefix survival
flat_rates = cum_rates.reshape(-1)
sorted_indices = torch.argsort(flat_rates, descending=True, stable=True)
wins = (ranks < extra_budget).to(torch.int32).sum(dim=1)
seqlens_q.copy_(1 + wins)
That is the reference version used in the test; production runs a fused TileLang kernel. Same math: cumprod turns per-position rates into prefix survival, a global sort picks the top extra_budget, each request's query length is 1 plus its wins.
Why does only a suffix need replay? SWA bounded replay and YOCO truncation
The problem: sliding windows and cache hits
Production DeepSeek keeps the KV cache for 72 hours or more (the Q&A's design goal), so a follow-up request often hits a long cached prefix. For the compressed block KV that is easy: it is stored and reused. The sliding-window (SWA) state is the problem. It is a ring buffer of the last 128 tokens per layer, and storing one per prefix position would be huge, so the cache stores it only at multiples of 128 tokens. A request whose cached prefix ends in the wrong place has no SWA state to continue from.
Receptive field arithmetic
You could rebuild the SWA state by recomputing the tail of the prefix. How much? A token at layer L sees 128 tokens back at its own layer, and those saw 128 back at layer L-1, so influence compounds. Across the 20 decoder layers, the exact receptive field is 20 * 128 = 2,560 tokens. The Q&A says it directly: reconstructing the decoder SWA cache exactly would require running the last 2,560 tokens through 20 decoder layers.
The trick: bound it
Bounded replay says: do not rebuild exactly, rebuild approximately. Replay only the last 128 tokens, and truncate the attention window to the replayed segment. When replaying from position s, a query at position i attends only to keys in max(s, i-127) to i. The result is an approximate SWA state whose cost is constant: 128 tokens (140 with margin) instead of 2,560, regardless of context length. Two uses, from the Q&A:
- Encoder bounded replay: on a prefix hit with missing SWA state, recompute the last 128 hit tokens along with the new suffix. Only the SWA state is rebuilt; block KV is reused untouched.
- Decoder bounded replay (YOCO truncation): prefill runs the 20 encoder layers over the full prompt, because they produce the block KV. The 20 consumer layers are only needed for their SWA cache for decode, so each prefill runs them over only the last 128 tokens of the prompt. The result never enters the prefix cache. The Q&A says this nearly halves total prefill compute, which fits: 20 of 40 layers shrink from full prompt to a few hundred tokens.
The hit-length rule is capped at L - 134: 128 for the window plus 6 for speculative backtracking (max(nextn + 1, ...) in DEEPINFER_MAX_BACKTRACKING_TOKENS). With nextn = 5 you may have to roll back up to 5 tokens plus one, so the ring buffer carries 6 extra slots.
Where it lives
export DEEPINFER_YOCO_PREFILL_TRUNCATION_MODE=compact
export DEEPINFER_YOCO_PREFILL_KEEP_TOKENS=140
The README says the retained suffix must cover the SWA window plus the maximum backtracking length: KEEP_TOKENS >= 128 + 6 = 134, and 140 is the value the README gives for the default V4.1 settings (the env var itself has no default, so you must set it when truncation is on). The modes in environ.py are off, mask and compact. mask keeps all queries and just narrows the SWA visibility (no compute saved), which is useful for checking numerics. compact really removes the truncated queries, so consumer layers compute over a shorter tensor. The C++ preparation (csrc/engine/input_metadata/prepare_tensor_input_v4.cpp) builds the compact index lists, and v4_modules/yoco.py gathers hidden states at the boundary. This is also compatible with context parallelism, which is why yoco_consumer_cp_mirror_len exists.
A worked comparison for a 100,000-token prompt, consumer layers only:
exact:   100,000 tokens * 20 layers = 2,000,000 token-layers
bounded:     140 tokens * 20 layers =     2,800 token-layers
Not a fair compute comparison for the whole model, since the 20 encoder layers still process everything, but it is why half the model's prefill cost simply vanishes. The cost is that the replayed SWA state is an approximation, and DeepSeek chose it because it measured the quality as acceptable. Note the code comment that YOCO truncation "allows result changes from preemption". Keep that in mind in the determinism section.
What is zero-overhead asynchronous scheduling?
The idle GPU problem
A naive decode step is: schedule on the CPU, launch the forward pass, sample, then wait for the sampled tokens to come back to the CPU so the host can post-process (check stop conditions, update the grammar, stream tokens) and schedule the next step. During post-process and scheduling the GPU does nothing. If the CPU work is a sizeable fraction of a decode step, you lose that fraction of GPU time on every step. The Q&A states the goal in one sentence: remove that idle period.
DeepInfer calls the solution ZOS (zero-overhead scheduling), switched by DEEPINFER_ZERO_OVERHEAD_SCHEDULING. It defaults to on for the NORMAL and COMPLETION engine types and off for the prefill-only engine (engine_type.py; arg_utils.py sets the env var at startup). The idea, which the Q&A credits to SGLang and NanoFlow: launch step N+1 before post-processing step N.
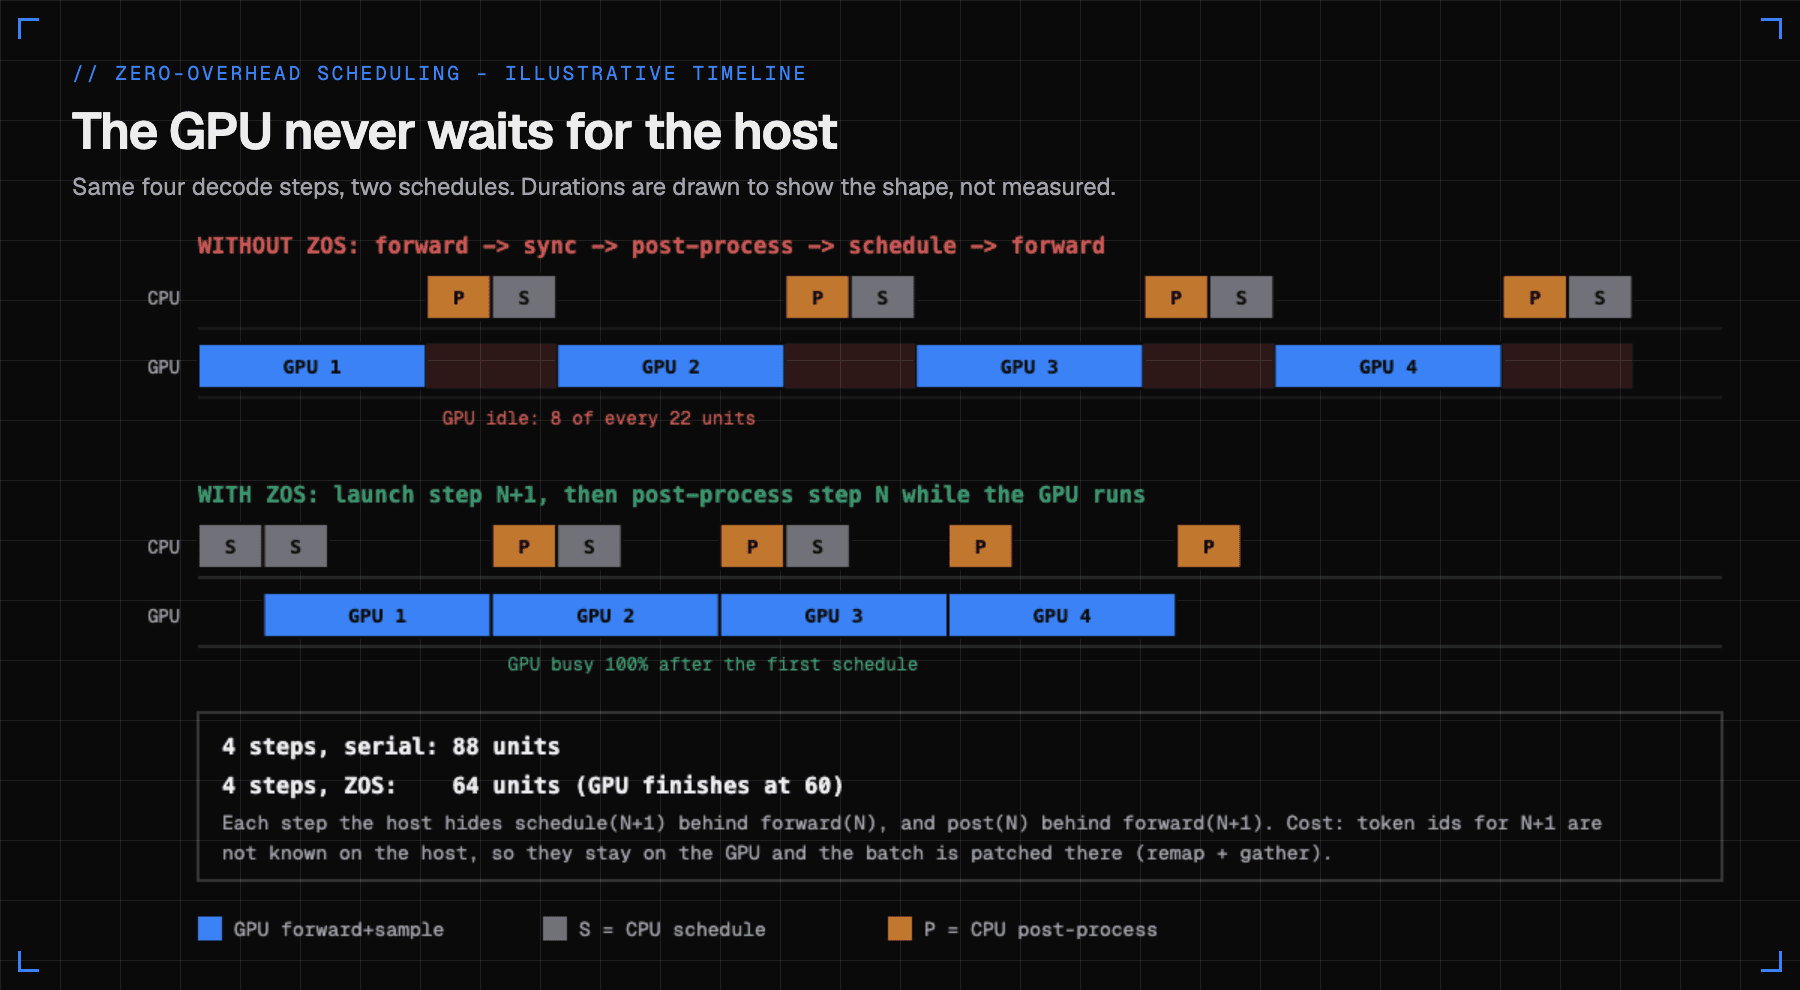
The same thing as a Gantt chart, with labels for what runs where:
The durations in both diagrams are drawn for shape. I did not measure them, and I could not: there is no GPU on my machine.
The hard part: step N+1 needs step N's output
If the host launches N+1 before N finished, it does not know N's sampled tokens, so it cannot even fill the input tensor. And with speculative decoding it does not know how many tokens N accepted, so it does not know each sequence's new length either. DeepInfer solves this by keeping everything on the device. The key function is Worker.execute_model_step in deepinfer/worker/worker.py. Its docstring is the algorithm:
1. Forward current step (main model)
2. Post-process previous step
3. Sample current step
4. Post-process current step: in place for prompt / non-ZOS steps;
   ZOS decode steps defer it to the next step to overlap with forward
And the ending of that function is the deferral:
if is_prompt or not envs.DEEPINFER_ZERO_OVERHEAD_SCHEDULING:
    request_outputs = np.concatenate([request_outputs, self._post_process_step(curr_step_state)])
    self.prev_step_state = None
else:
    self.prev_step_state = curr_step_state
The mechanism that makes N+1's inputs correct is _correct_seqlens_qk. The CPU's seqlens_q/seqlens_k lag one step behind, so for requests that were in the previous batch, the worker builds a remap (remap[i] = j if the current batch row i is the previous batch row j, else -1) and patches the metadata on the GPU:
- Input token ids are gathered from the previous step's sampled and predicted tokens (
prev_sampled_token_ids,prev_predict_token_ids) using the remap. Tokens never visit the host. seqlens_kis corrected with the previous step's accepted counts (compute_seqlens_k_zos).- If varlen is on,
seqlens_qis recomputed from the previous confidence (the GPU kernel above), then copied back to pinned host memory through a D2H copy with an event, because the sampler still needs the CPU view.
Notice the explicit d2h_evt.synchronize() before sampling: it waits for exactly one small tensor, not for the whole step.
Guarding against accidental syncs
The whole scheme dies if any code in the launch path secretly blocks on the GPU. execute_main_model has a docstring that says "This function must NOT contain any cuda synchronize", and enforces it:
with (
    cpu_timer.record("launch_forward", record_name=f"launch_forward_N{input_metadata.num_reqs}_B{total_q}"),
    cuda_timer.record("device_forward", scale=1),
    forbid_cuda_sync(),
):
forbid_cuda_sync() (in deepinfer/utils.py) raises on any torch-visible blocking copy or synchronize in scope. Event synchronization is deliberately exempt, so intended wait points still work. DEEPINFER_DISABLE_SYNC_GUARD=1 turns it off for debugging. I like this a lot: a performance invariant turned into a runtime assertion.
Two consequences show up in config. The runtime maximum length gets padding for the speculative lookahead (_get_runtime_max_model_len in config.py adds nextn + (nextn + 1 if ZOS else 0) for the scheduler, plus another nextn for the draft), because under ZOS a sequence can be scheduled one step before the host knows it ended. And finished-request flushing needs a special call, flush_inflight_reqs, since there is always one step of results in flight.
Why does batch composition change the answer? Batch-invariant inference
Floating point is not associative
Here is the part that surprises people. Run the same prompt twice, greedy, same weights, on the same GPU, but with a different set of other requests in the batch, and you can get different tokens. Not because of a bug: because of floating point addition order.
In 32-bit floats, (a + b) + c and a + (b + c) can differ. A classic case, checked with float32 rounding emulation (Math.fround in Node):
a = 1e8, b = -1e8, c = 1
(a + b) + c = 1
a + (b + c) = 0        because -1e8 + 1 rounds back to -1e8 (spacing near 1e8 is 8)
Now apply that to a dot product. Take 4,096 float32 values (5,000 plus Gaussian noise with sigma 1,000, and a much larger Gaussian outlier added on every 64th value, from a fixed-seed generator) and sum them in four orders. The exact sum in 64-bit is 18,327,227.14:
| Order | float32 result |
|---|---|
| Sequential | 18,327,238 |
| 4 interleaved partial sums | 18,327,224 |
| 16 partial sums | 18,327,228 |
| 64 partial sums | 18,327,226 |
Every order is "correct" and every order is different. A GEMM kernel does exactly this: it splits the reduction dimension across thread blocks (split-K) and tiles, and which split it picks depends on the matrix shape, and the shape depends on how many other requests are in the batch. With a batch of 1 row you get one reduction order, with 64 rows another. A different last bit in one layer is amplified over 40 layers and 129,280 logits, and eventually flips an argmax. That is why serving the "same" request twice can produce different text under load.
What DeepInfer does about it
README: DEEPINFER_BATCH_INVARIANT=1 "keeps model results identical across different batch compositions" (NVIDIA only; runtime_config.py asserts the flag is off on NPU). The example script examples/offline_inference.py turns it on by default for NVIDIA. The implementation is a set of places where reduction order is pinned:
deep_gemm.use_deterministic_algorithms(True)and the same fortile_kernels, set inruntime_config.py.- FlashMLA is called with
batch_invariant=envs.DEEPINFER_BATCH_INVARIANTin both the decode and the DSpark attention paths inattn.py. - DeepEP's
allow_multiple_reductionis switched off when batch invariance and EPLB rearrangement are both on (userbuffer.py), because a replicated expert's partial outputs could otherwise be summed in a different order depending on where the copy lives.
The price is presumably speed: deterministic kernels give up the shape-dependent fastest split. It is a testing and reproducibility tool (the repo's PPL regression baselines in tests/models/offline_decode_ppl.json are compared exactly, sample by sample), not the default for serving.
Deterministic sampling
Batch invariance fixes the logits. Sampling must be fixed too. torch.multinomial draws from a shared random stream, so a request's random numbers depend on its place in the batch. DeepInfer's sampler instead derives each uniform random number from the request's own seed and position. The reference implementation in tilelang_ops/random_sampling.py:
def random_sampling_ref(probs, seq_seeds, sample_positions, is_nextn_predict=False):
    sample_case = 1 if is_nextn_predict else 0
    seq = (sample_positions.to(torch.int64) * 3 + sample_case) * i64(0x9E3779B97F4A7C15)
    combined = seq_seeds.to(torch.int64) + (seq ^ (seq * (1 << 13)))
    u = _hash_to_uniform(combined).unsqueeze(-1)
    cdf = probs.double().cumsum(dim=-1)
    target = u * cdf[:, -1:]
    return (cdf > target).long().argmax(dim=-1).int()
A SplitMix64 hash of (seed, position, case) gives a uniform in [0, 1), then it inverts the CDF in float64. The docstring promises the output is "deterministic in (seq_seeds, sample_positions, is_nextn_predict): independent of batch size and row order". To use it: DEEPINFER_BATCH_INVARIANT=1 DEEPINFER_ENABLE_MTP_VARLEN=0 and pass a fixed seq_seed in SamplingParams. Varlen must be off, and my reading is that confidence scheduling picks the verified length from a throughput curve over the whole batch, so a request's own verified length would depend on its neighbors. Plain fixed-length speculation does not have that coupling.
How do structured outputs work: regex, JSON schema, EBNF?
Structured output forces the model to produce text matching a format. The idea: at each step, compute which tokens would keep the output valid, set the logits of all others to minus infinity, then sample. Doing that over a 129,280-token vocabulary at every step is the cost, and a grammar automaton makes it cheap.
DeepInfer uses xgrammar (deepinfer/structure_output/compiler.py). The API is one extra field:
SamplingParams(
    temperature=0,
    max_tokens=128,
    so_args={"schema_type": "regex", "schema": r"[A-Z]{2}-[0-9]{3}"},
)
schema_type is "regex", "json" (a JSON schema, compiled with strict_mode=True) or "ebnf". The repo's check, examples/_structured_output.py, runs all three with prompts that beg the model to ramble, and asserts the output still fully matches, for example answer=(yes|no);level=[1-3] for the EBNF case.
The lifecycle matters more than the API. Compilation is slow (it builds a token-level automaton), so SOMatcherBuilder compiles on background workers (DEEPINFER_SO_BUILDER_CPUS, default 4) and a request does not enter the scheduler until its matcher is ready (has_pending counts in-flight compiles). The compiler has a kill switch for the cache and a size limit, with a comment pointing at a known xgrammar cache DoS (CVE-2025-32381): an attacker can submit unlimited distinct schemas. The default cache cap is 10 GiB.
The most interesting interaction is with speculative decoding. Draft tokens must obey the grammar too, or you would verify tokens that could never be valid. In sampler.py the matcher walks the drafts, accepting each token and building a mask per draft position, then rolls back:
for k, draft_token in enumerate(seq_metadata.last_next_n_token):
    if matcher.accept_token(draft_token):
        if matcher.constrained():
            mask_filled = matcher.fill_vocab_mask(self.bitmasks_cpu[k + 1], idx)
            so_indices_cpu[k + 1].append(idx)
        num_accepted_steps += 1
    else:
        break
matcher.rollback(num_accepted_steps)
So a request with 5 drafts gets 6 masks (one per position), the first illegal draft ends the walk, and the matcher state rolls back to where it started so the real accepted tokens can be fed in afterwards. One more design choice I appreciate: an error in one request's grammar sets that request to FINISHED_SO_FAILED instead of raising, because (the comment explains) an exception on the CP rank 0 sampling path would take down every request and cause an NCCL barrier timeout.
How does DeepInfer compare with vLLM and SGLang?
DeepInfer is not a replacement for them, and it does not try to be. The README says it was built primarily on vLLM, and the header of deepinfer/config.py says "Derived from vLLM; modified by DeepSeek." Press coverage (SiliconANGLE) recalls that DeepSeek described its internal engine in April 2025 as an early fork of vLLM. Think of it as a vLLM-descended engine specialized hard for one model.
| Dimension | DeepInfer | vLLM / SGLang |
|---|---|---|
| Models | One (V4.1-Flash) | Hundreds |
| Scheduler | C++, DP-aware step-type vote | Mostly Python |
| Async scheduling | ZOS with on-device token remap | Present in both, DeepInfer cites SGLang and NanoFlow |
| Speculation | DSpark with confidence-scheduled varlen verify | Supported; vLLM announced DSpark with adaptive verification |
| Serving stack | Offline engine only: no KV store, no LB, no PD router | Full online servers |
| Kernels | DeepSeek's own libraries, hand-matched to the model | Mixed, some DeepSeek kernels reused |
On performance, the fairest statement I can make is: DeepSeek published its own Pareto charts, and nobody has independently reproduced them. vLLM's October 23 post (Serving DeepSeek-V4.1-Flash at Scale) claims its decode is within 6 percent of DeepInfer's published results across batch sizes 8 to 256 on GB200 (131K context, nextn = 3), but by its own account it read DeepInfer's numbers off the README charts rather than rerunning DeepInfer, and it says it does not read the prefill gap as an engine-to-engine speedup because the setups differ (EP4DP4 with 32 redundant experts and a 140-token replay for DeepInfer, DEP2 with none and 128 for vLLM). The two engines also share DeepSeek's kernels. The honest summary: the kernels do most of the work, and the engine around them can be matched.
What you cannot get from either is the shape of the code. Reading DeepInfer is a good way to see how much of a production engine is not the model at all: step-type voting, a fused-kernel scheduler budget, sync guards, grammar lifecycles, state slots.
What is next: porting these ideas to Apple Silicon
None of this runs on my Mac. DeepInfer needs CUDA 13, SM100 GPUs and GCC 13, and its kernels assume NVLink. But the ideas do travel: launch the next step before processing the last, keep sampled tokens on the device, and use a drafter with a confidence head to decide how many tokens to verify, so every read of the weights serves many tokens. I have been experimenting with the speculative-decoding side of those ideas (a DSpark-style drafter with a Neural Engine target) on Apple Silicon, where the Neural Engine and the GPU have a very different memory-bandwidth balance. That is a separate story, and I will write it up after this one.
FAQ
What is DeepInfer?
The inference engine DeepSeek uses to serve DeepSeek-V4.1-Flash in production. DeepSeek open-sourced it on October 20, 2026 under Apache-2.0: about 46,000 lines of Python plus a C++ scheduler.
Which models and hardware does DeepInfer support?
One model, DeepSeek-V4.1-Flash (a 552B-parameter MoE with 384 routed experts, 6 active per token), on NVIDIA SM100 and Huawei Ascend 950.
What is DSpark in DeepInfer?
DeepSeek's speculative decoding path: a small drafter proposes several tokens, the big model verifies them in one pass, and confidence estimates decide how many drafted tokens to verify.
Is DeepInfer a full serving stack like vLLM or SGLang?
No. It is an offline-inference release, originally built primarily on vLLM. The KV cache store, prefill/decode disaggregation and load balancers are not included.
DeepInfer is less a new algorithm than a catalogue of production engineering for one MoE model: a C++ scheduler that votes on step type across DP ranks, wide expert parallelism with measured load balance of 1.05 to 1.09, a drafter whose confidence head turns a fixed 5-token verify into a throughput-optimal variable one (+4 to 7 percent at the production point, per DeepSeek), bounded replay that makes a 2,560-token rebuild cost about 140 tokens, and an async pipeline that keeps tokens on the device and enforces no-sync at runtime. It is Apache-2.0 and genuinely worth reading, but it is an offline-inference release for one model on SM100 or Ascend, and the headline throughput numbers are DeepSeek's own.
References
- DeepSeek DeepInfer repository (README, license, source)
- My fork: vakharwalad23/DeepInfer
- DeepSeek announcement post on X, October 20, 2026
- DeepSeek-V4.1-Flash-1017 model card and config.json on Hugging Face
- DeepSeek-V4.1-Flash: Pushing the Limits of KV Cache Compression (arXiv 2609.19969)
- DSpark: Confidence-Scheduled Speculative Decoding with Semi-Autoregressive Generation (arXiv 2607.05147)
- deepseek-ai/dspark_qwen3_8b_block7 drafter checkpoint
- FlashMLA, DeepGEMM, DeepEP, TileKernels, DeepSelect
- TileLang
- TechNode: DeepSeek wants better AI at lower cost
- SiliconANGLE: DeepSeek open-sources DeepInfer
- Let's Data Science: DeepSeek open-sources DeepInfer
- vLLM: Serving DeepSeek-V4.1-Flash at Scale
- vLLM on X: V4.1-Flash support announcement
- Bear the Tokens: suffix speculative decoding on a Tesla T4